S(ound)lab: A python package for running psychoacoustic experiments
Motivation#
When I started to do research in auditory neuroscience, I quickly realized that studying Biology did not teach me the coding skills I needed for designing and running my own experiments. Many students at the start of their research careers share this experience. Thus, they either delay their research by first learning how to code or they turn to programs that allow them to arrange experiments by clicking and dragging predefined components. While these programs offer a quick solution, they are often opaque and limit understanding in the long run.
We wanted to create a toolbox that quickly enabled inexperienced users to run experiments while teaching them fundamentals in coding, digital signal processing and experimental design. At the same time, it should be comprehensive and flexible enough to implement complex and innovative auditory experiments 1.
Design#
Rather than ready-made solutions, slab provides basic building blocks that are implemented in complementary modules. This allows new users to focus on individual modules, provides flexibility and keeps code clean and maintainable. While slab provides useful functions with sensible defaults it does not limit the user to those - any slab data structure can be instantiated from a Numpy array, granting maximal flexibility.
Because slab is teaching-oriented, it provides extensive online documentation with hands-on tutorials on all core functions. We developed slab in close interaction with the students who tested it to make sure it is intuitive to beginners.
Example#
For a demonstration of slab, let’s consider the implementation of a pure tone audiogram. The code below generates different tones and uses a staircase procedure to estimate the hearing threshold at each frequency
The method staircase.present_tone_trial() plays the tone, waits for the listeners response (press 1 if you heard it and 2 if you didn’t) and then decreases of increases the sound’s level depending on whether or not it was heard. This goes on until a certain number of reversals have happened (here 5). The threshold at a given frequency is given by the mean intensity of all reversal points.
import slab
from matplotlib import pyplot as plt
frequencies = [125, 250, 500, 1000, 2000, 4000]
threshs = []
for frequency in freqs:
stimulus = slab.Sound.tone(frequency=frequency, duration=0.5)
staircase = slab.Staircase(start_val=50, n_reversals=5)
print(f'Starting staircase with {frequency} Hz:')
for level in staircase:
stimulus.level = level
staircase.present_tone_trial(stimulus)
staircase.print_trial_info()
threshs.append(staircase.threshold())
print(f'Threshold at {frequency} Hz: {staircase.threshold()} dB')
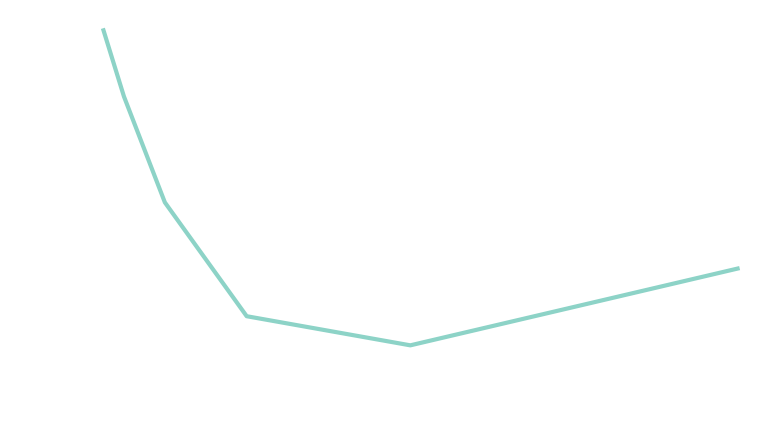
plt.plot(freqs, threshs) # plot the audiogram
If we plot the estimated threshold levels against the frequencies, we can see how the ability to detect a tone changes with its frequency 2:
Resources#
If you are interested in using slab, you can check out the projects GitHub page and online documentation. You may also want to read the corresponding paper we published in the Journal of Open Source Software 3.
Footnotes#
Slab does not implement any visual components, it focuses on purely auditory experiments ↩︎
If the setup is not calibrated with a sound meter, the threshold intensities can’t be interpreted as absolute magnitudes but only relative to each other ↩︎
See: Schönwiesner, M., & Bialas, O. (2021). s(ound) lab: An easy to learn Python package for designing and running psychoacoustic experiments ↩︎